What do Sequence Orders, Global Sea-Level Curves, Wheeler Diagrams, and VCRs have in common?
It’s the holiday season. A lot of us will receive fancy tool-boxes as gifts. Unless you’re a carpenter or a handyman, how many of these will you actually use?
This post like most of my others is very opinionated but hoping it stirs the pot and makes you think.
In college I worked for the Institute of Arctic and Alpine Research in Boulder, USA. Modern sediment core would arrive from Baffin Island, and I was the lucky-dog to sample every inch for Planktonic Forams to look at O18/O16 isotopes and figure out glacio-eustatic changes. So there’s a tool: High-resolution sequence-stratigraphy. What can you do with it? A lot if you’re an academic. Not much if you’re working a fractured carbonate in the Middle East. So yes, the tool exists, but is it right for you?
Lets talk about Sequence Orders next. I cant recall the number of times I have been in a meeting at a company where the presenter says
“so in this 4th order sequence here….” TIME-OUT how do you know its 4th order? What is a 4th order sequence anyways? I know I have the biostrat background – but do you? How many index fossil taxa did you look at to interpret this as a 4th order sequence? You didn’t! but you thought using the word would impress the hell out of the crowd (and in some cases it does). So let’s assume you did your homework, you’re Mr. Biostrat and this is indeed a 4th Order Depositional Sequence just like Peter Vail meant it. Now what? does knowing its 4th order going to help you find that gas filled-tidal channel? it wont. So why even mess with sequence orders?
Yes its controversial – all the more reason for you to read it!
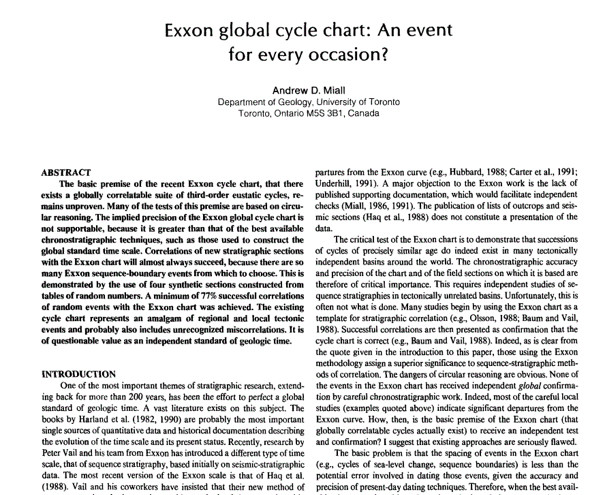
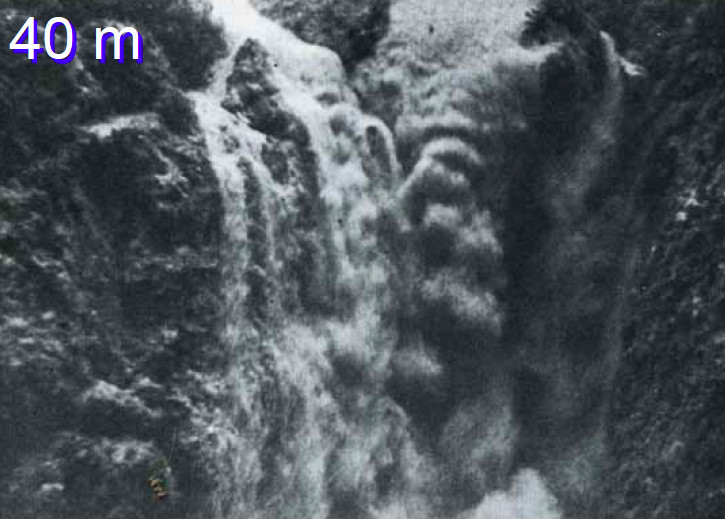
Another tool that many just cant seem to go without are global sea-level curves. Andrew Miall did a fairly decent job at showing how ridiculous these can be. But hey why read something by the one of the most brilliant sedimentologists of our time? Right now we are in a global highstand (or “high-sea level” to be PC). Most would agree that sea-level is rising. But the sands being delivered to the basin floor through Monterey Canyon in California or San Lucas Canyon in Mexico obviously didn’t get that memo. I guess no one told them that sands should ONLY be delivered into deep-marine environments during Lowstands – they’re breaking all kinds of rules. So if that’s what you’re using in the year 2022 to find deepwater sands, maybe you should add a Tarot Card reading to your workflow.
That is longshore drift-captured sand being delivered through a canyon into deepwater environment (Shepard and Dill, 1966) while global sea-level is rising.
Finally there are Wheeler Diagrams. I think its fantastic that you now have software that can do this for you. What exactly are we plotting and why? Originally the idea was to be able to plot time against sedimentation. So how do you know what time (age) these packages were deposited? Are you by chance a biostratigrapher? Maybe you are. Now that you have so eloquently displayed these sedimentary packages and told me that my sequence boundary means 357,985.7 years of missing time, how is that going to help me geosteer my drill bit in that sweet spot in my unconventional shale-gas play? Oh but you say they are useful in conventional plays. So I guess now I can use that Wheeler Diagram to figure out whether to drill this carbonate mound’s core or flank? Ah so its for conventional sandstone reservoirs you say, ok great so can I can use it to correlate these deepwater lobes? You get the point.
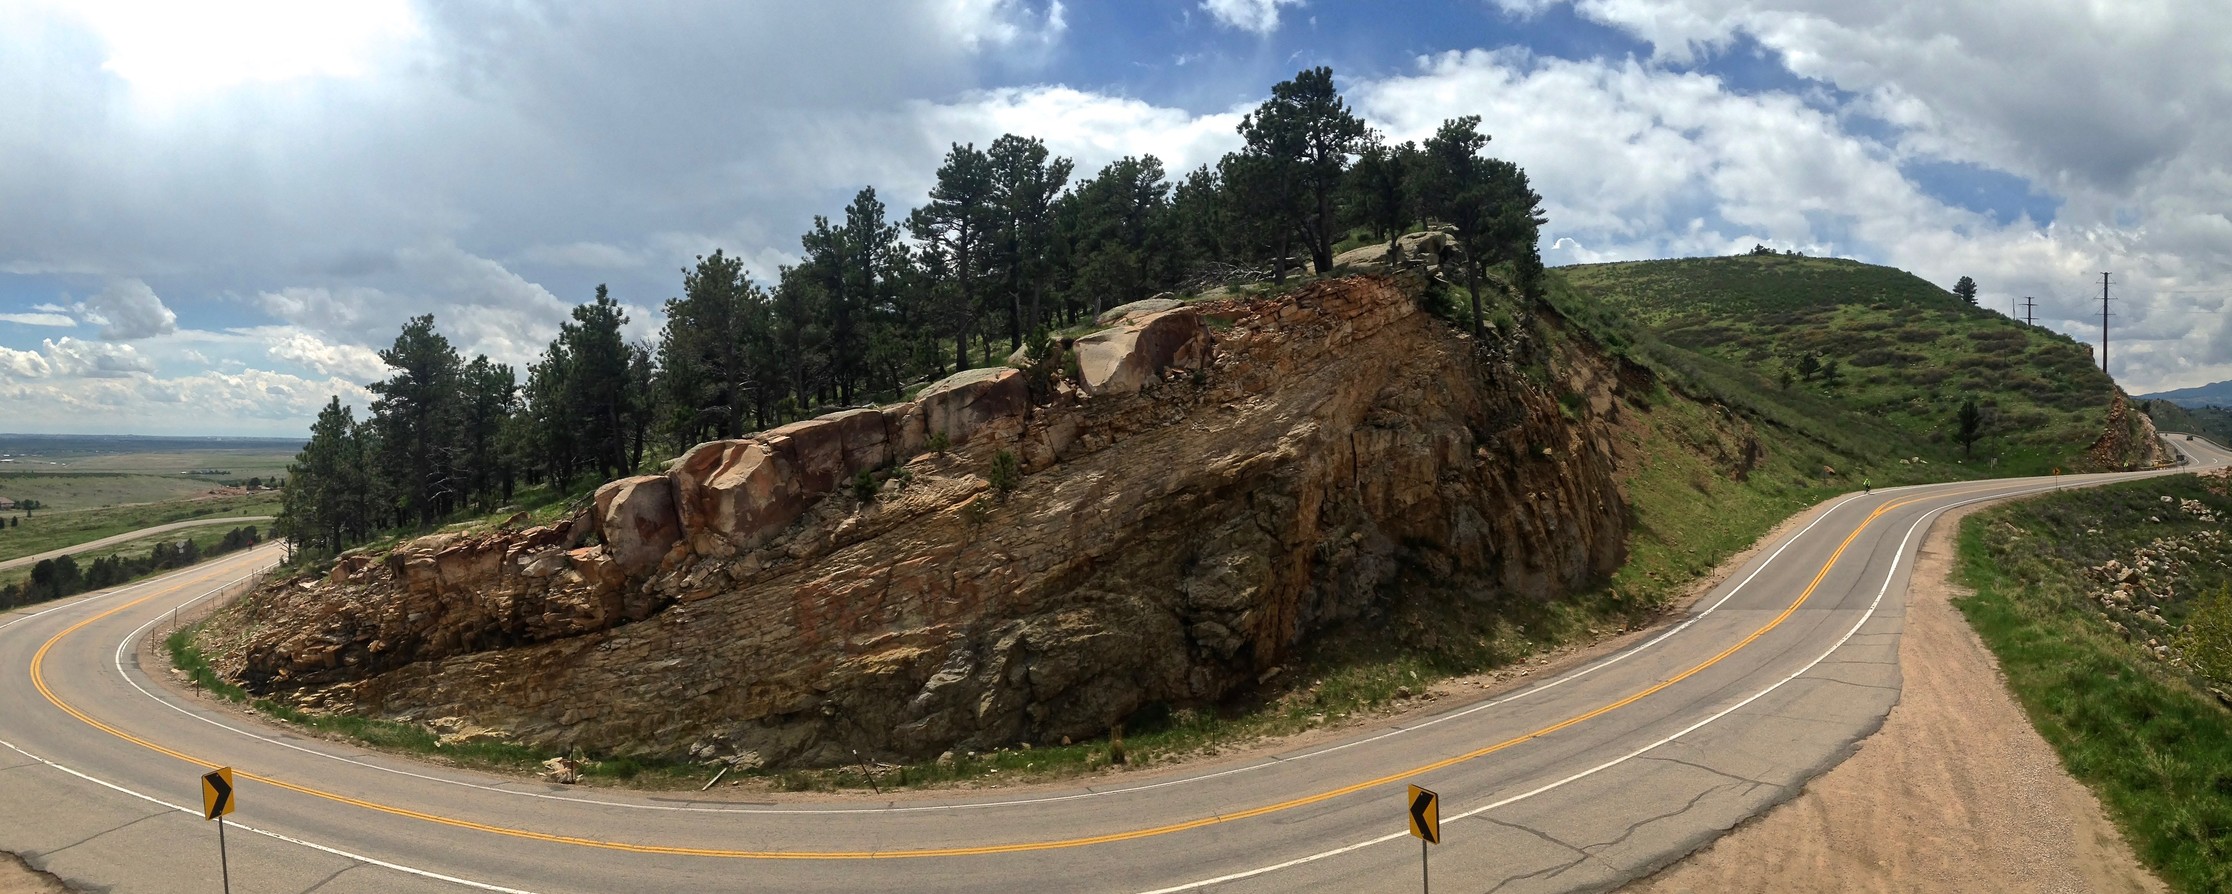
Sequence boundary and tidal ravinement surface separate incised valley fill and lower shoreface – lots of missing time, sandstones are in communication = same flow unit
To conclude, there are many tools available to the oil and gas professional today. Somewhere, someone may still find global sea-level charts, wheeler diagrams and sequence orders useful. But if your goal is finding and exploiting a reservoir efficiently, there are better ways of doing so.


Post a comment
You must be logged in to post a comment.